Data and Statistics
I/A system performance with respect to total nitrogen removal for single family homes is now available online.
System Total Nitrogen Removal Performance Charts
Box-Whisker Diagrams
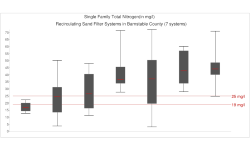
Use an interactive charting system that allows you to look at live performance data for individual technologies and individual towns.
Median Histograms
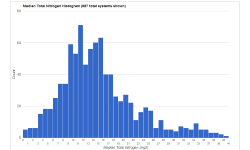
See how I/A systems perform overall in relation to median TN removal, or break the data down by town, technology and occupancy type.
Other Statistical Data
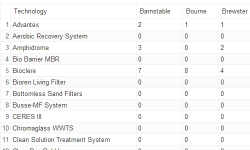
System Count Bubble Diagram
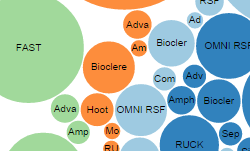
See how many of each system type are in each town in our database.
View Charts