Statistical Analyses
Box-Whisker Plots
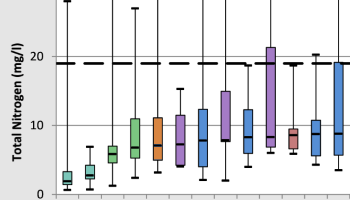
Use an interactive box-whisker plotting system that allows you to look at live performance data for individual technologies and individual towns.
Median Histograms
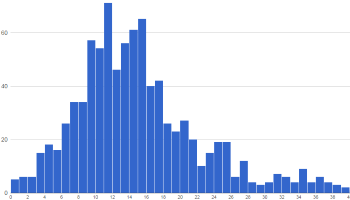
See how I/A systems perform overall in relation to median TN removal, or break the data down by town, technology and occupancy type.
System Count Bubble Diagram
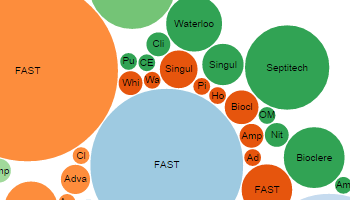
See how many of each system type are in each town in our database.